
Exploring Sine Functions
Erin Mueller
Given the following function; y=a(sin(bx+c)), the value of “a”
will affect the amplitude.
The value of “b” will change the period and the value of
“c” will alter the position that our function starts at on the x-axis. The
original sine function below begins at x=0. Changing “c” will either move right
or left depending on whether “c” is positive or negative.
![]()
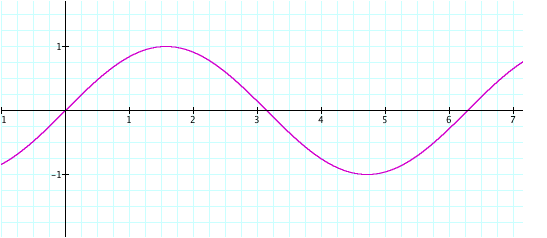
Above, we can see the graph of a regular sine graph. However,
watch what happens when we change certain characteristics to the sine graph.
When we change the value of “a” in y=a(sin(x)), we will change the amplitude. The amplitude represents
the maximum value for which the sine graph will reach on the y-axis before it
begins to descend. The amplitude for the original sine function is 1.
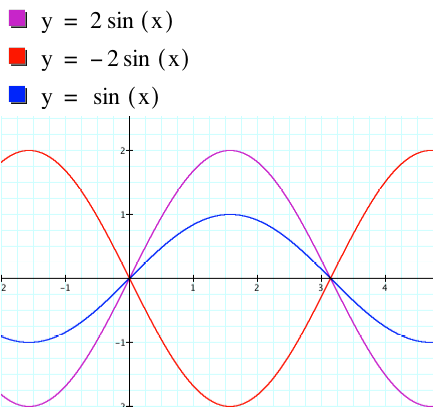
The functions above represent the change in our “a” value. For the
purple graph, our “a” value is 2. When the “a” value becomes negative, the
graph is flipped about the y-axis. We can also see that the amplitude is 2 when
our “a” value is positive 2 or negative 2. The original sine graph is blue.
From this point, we can see the changes that our “a” value creates. Below, we
can see what happens as “a” is increased and decreased.
When we alter the value of “b” in our y=a(sin(bx+c)) function, the
period changes. The period of the original
sine function is 2![]() . This means that after x=2
. This means that after x=2![]() , the graph will begin to repeat itself. From the graphs
below, we can observe what happens when the value of “b” is increased and
decreased.
, the graph will begin to repeat itself. From the graphs
below, we can observe what happens when the value of “b” is increased and
decreased.
![]()
![]()
![]()
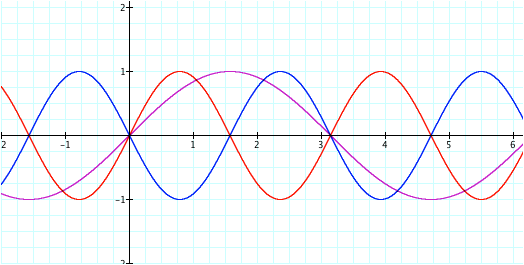
Now we know that y=sin(2x) (red graph) essentially cuts the period
of the function in half. The period is now ![]() instead of 2
instead of 2![]() . Since
. Since ![]() is approximately
3.14…, this corresponds to the point in the graph
(red) above at which our graph starts to repeat. From this, we can generalize
that the period is equal to
is approximately
3.14…, this corresponds to the point in the graph
(red) above at which our graph starts to repeat. From this, we can generalize
that the period is equal to ![]() . The blue graph above simply represents the fact that when
the value of “b” is negative, our function is reflected across the x-axis. From
the video below, we can see the effects that "b" has on the sine
function.
. The blue graph above simply represents the fact that when
the value of “b” is negative, our function is reflected across the x-axis. From
the video below, we can see the effects that "b" has on the sine
function.
The “c” value in y=a(sin(bx+c))
represents the starting x-value for the graph. If our “c” value is increased,
the graph will shift “c” units to the left. If our “c” value is decreased, the
graph will shift “c” units to the right. This is shown below.
![]()
![]()
![]()
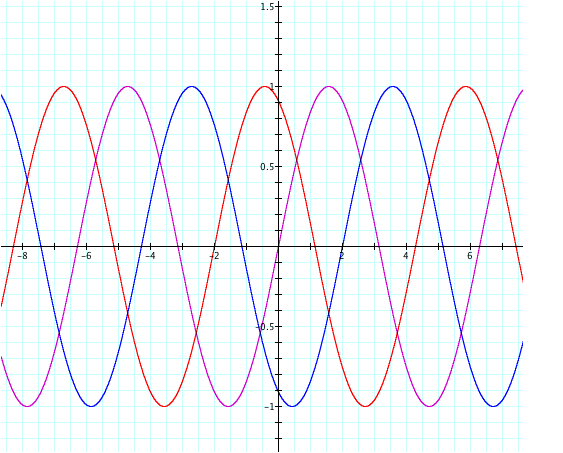
As we can see from the picture above, our purple graph represents the original sine function, y=sin(x). The red graph represents our sine function that has shifted 2 units to the left and our blue graph shows the sine function shifted 2 units to the right. From the video below, we can see the changes that occur as "c" is increased and decreased. Notice that when "c" is positive, the function moves left and when "c" is negative, the function moves right.